Small Animal Imaging
Cancer and Cardiovascular Research Building (CCRB)
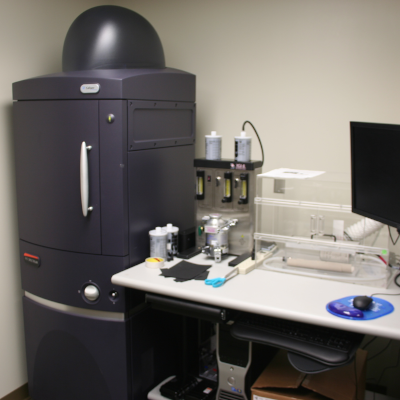
IVIS Spectrum In vivo Imaging System
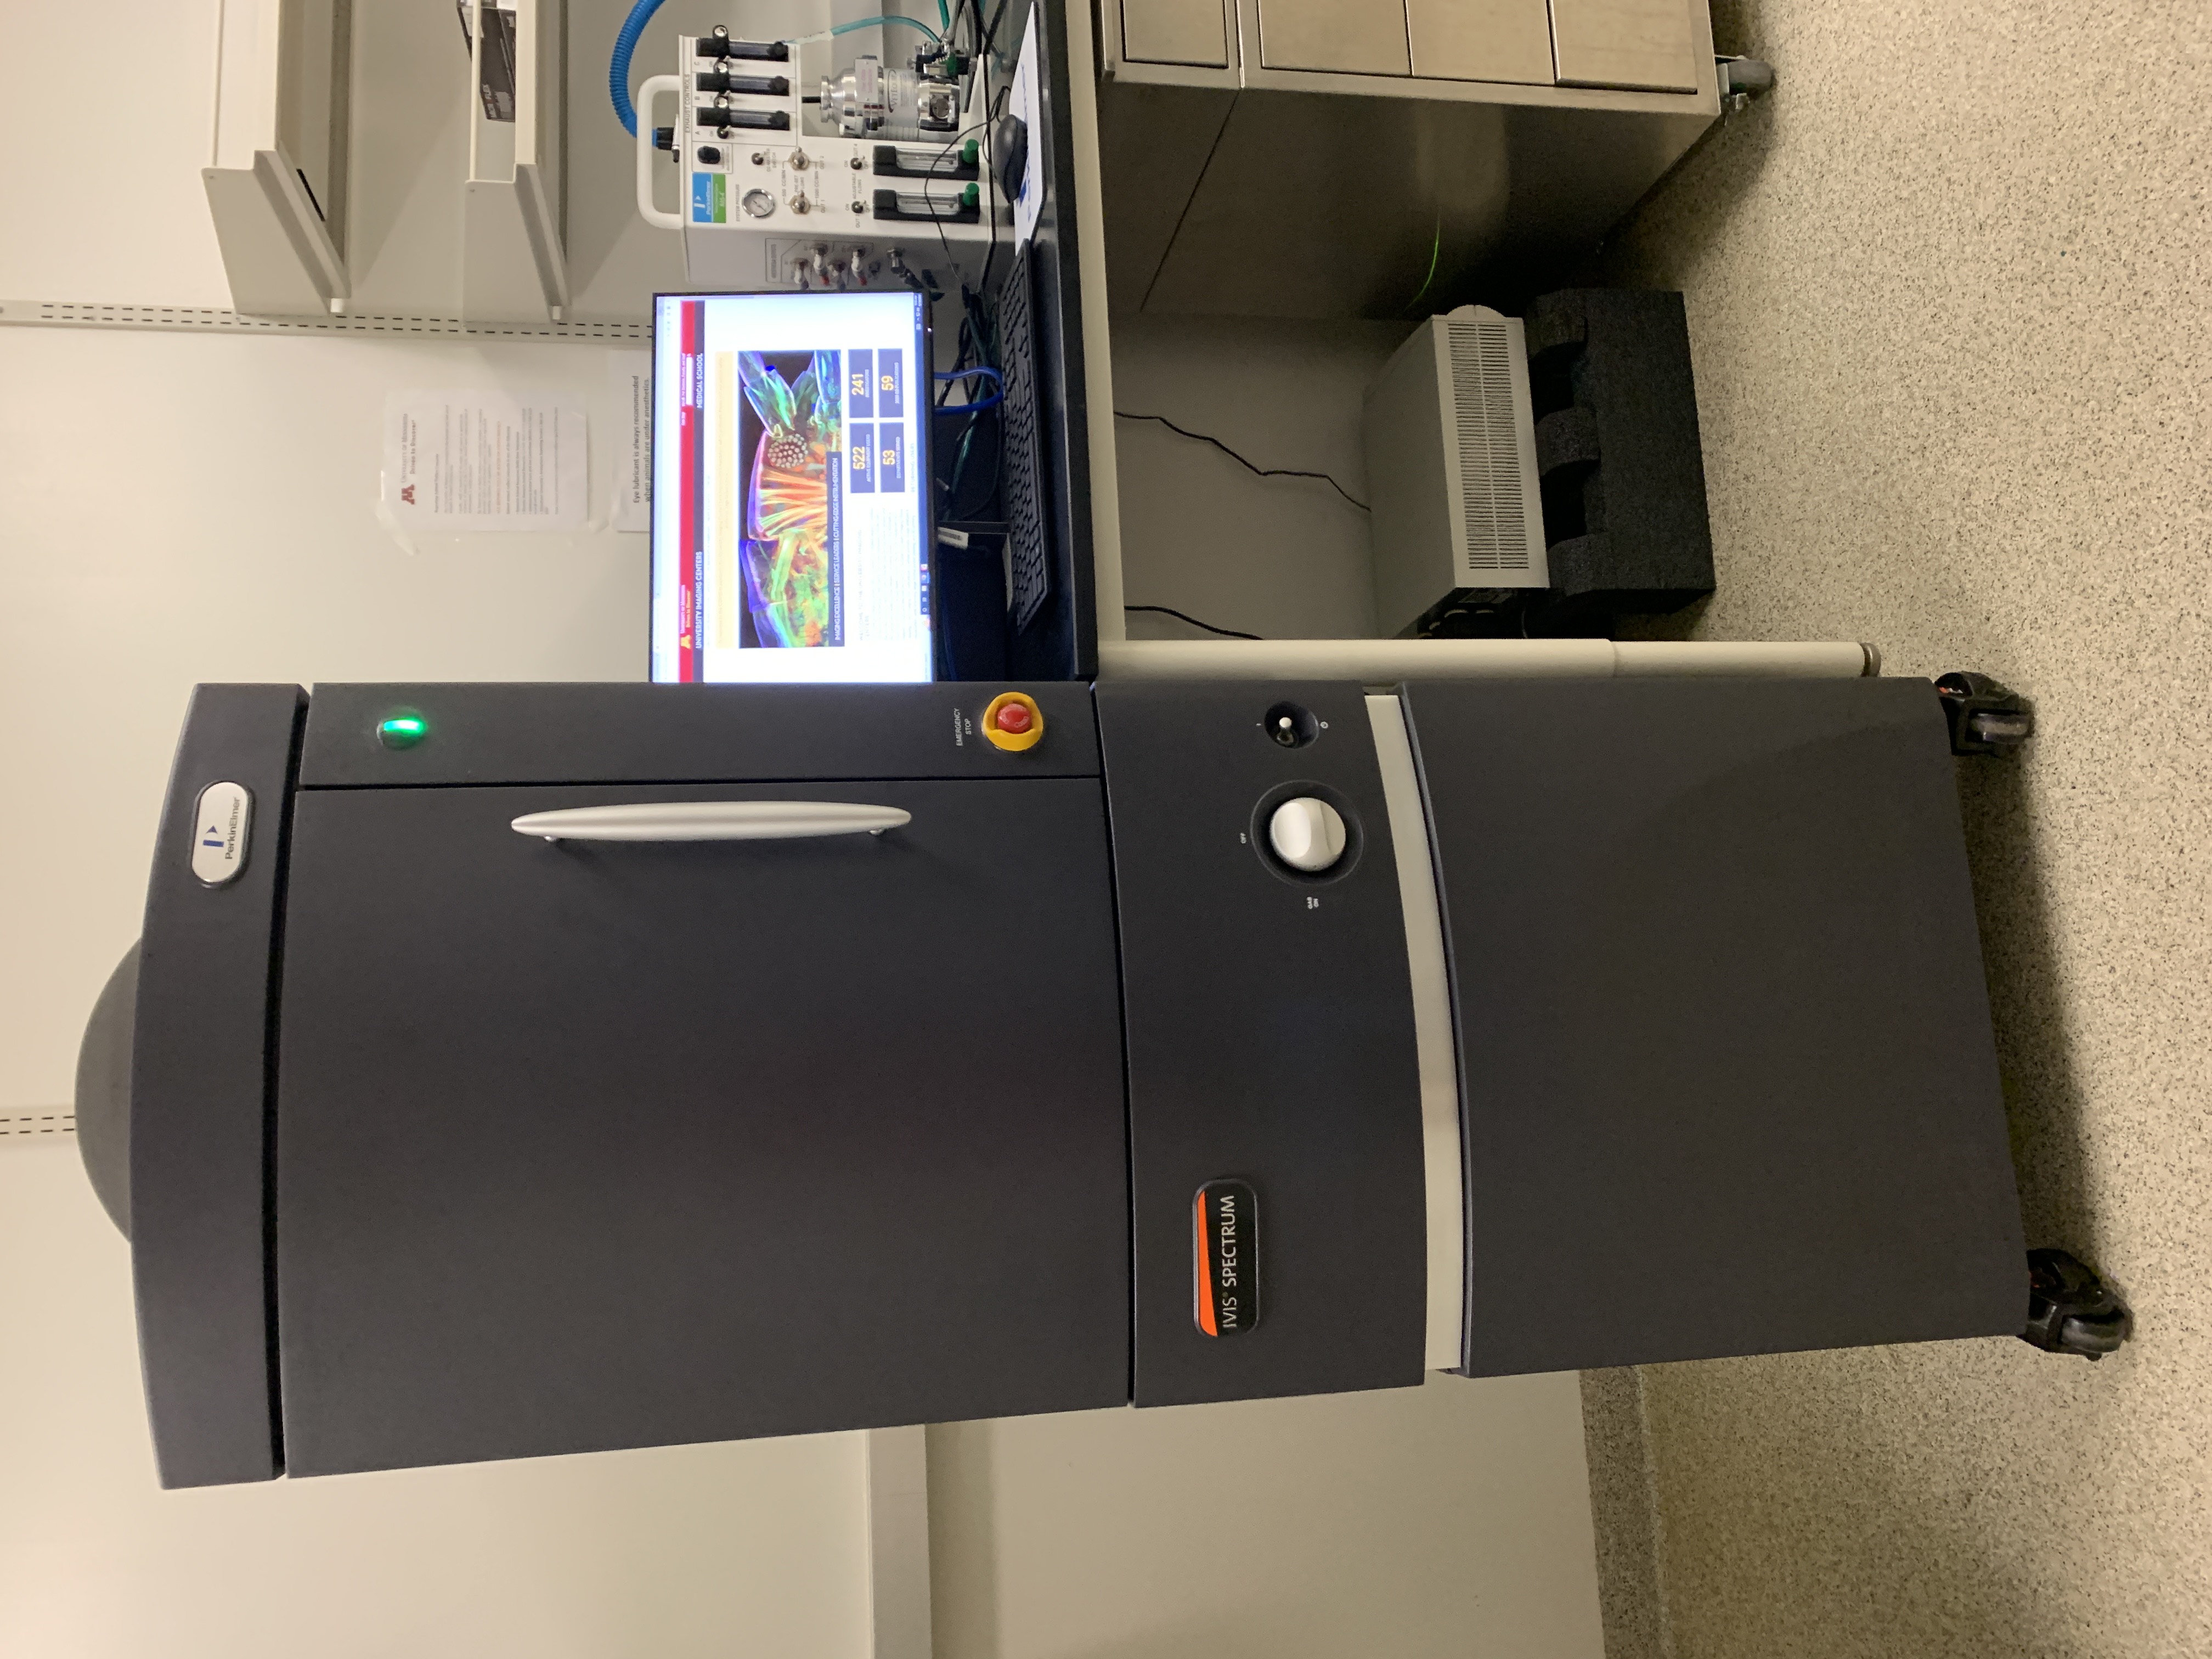
IVIS Spectrum
The IVIS Spectrum is the most versatile and advanced optical animal in vivo imaging system available on the market today. An optimized set of high-efficiency filters and spectral unmixing algorithms lets you take full advantage of bioluminescent and fluorescent reporters across the blue to near-infrared wavelength region. It also offers 3D tomography for both fluorescent and bioluminescent reporters that can be analyzed in an anatomical context using the Digital Mouse Atlas.
For advanced fluorescence imaging, the IVIS Spectrum has the capability to use either trans-illumination (from the bottom) or epi-illumination (from the top) to illuminate in vivo fluorescent sources. 3D diffuse fluorescence tomography can be performed to determine source localization and concentration using the combination of structured light and trans-illumination fluorescent images. The instrument is equipped with 10 narrow-band excitation filters (30 nm bandwidth) and 18 narrow-band emission filters (20 nm bandwidth) that assist in significantly reducing autofluorescence by the spectral scanning of filters and the use of spectral unmixing algorithms. In addition, the spectral unmixing tools allow the researcher to separate signals from multiple fluorescent reporters within the same animal.
Detector
- Andor Back-thinned, Back-illuminated CCD, cooled to -90 degrees C
- 2048 x 2048 Pixels Array, 13.5-micron sensor size
- 21.5 cm maximum image width (up to 5 mice)
Excitation
- 430-745 nm (10 filters)
- ND2 filter for trans-illumination
Emission
10 excitation filters with 30 nm bandwidth, and 18 emission filters with 20 nm bandwidth. The central filter wavelength is listed.
| Excitation | Emission |
|---|---|
| 430 | 500 |
| 465 | 520 |
| 500 | 540 |
| 535 | 560 |
| 570 | 580 |
| 605 | 600 |
| 640 | 620 |
| 675 | 640 |
| 710 | 660 |
| 745 | 680 |
| 700 | |
| 720 | |
| 740 | |
| 760 | |
| 780 | |
| 800 | |
| 820 | |
| 840 |
G8 µPET/CT
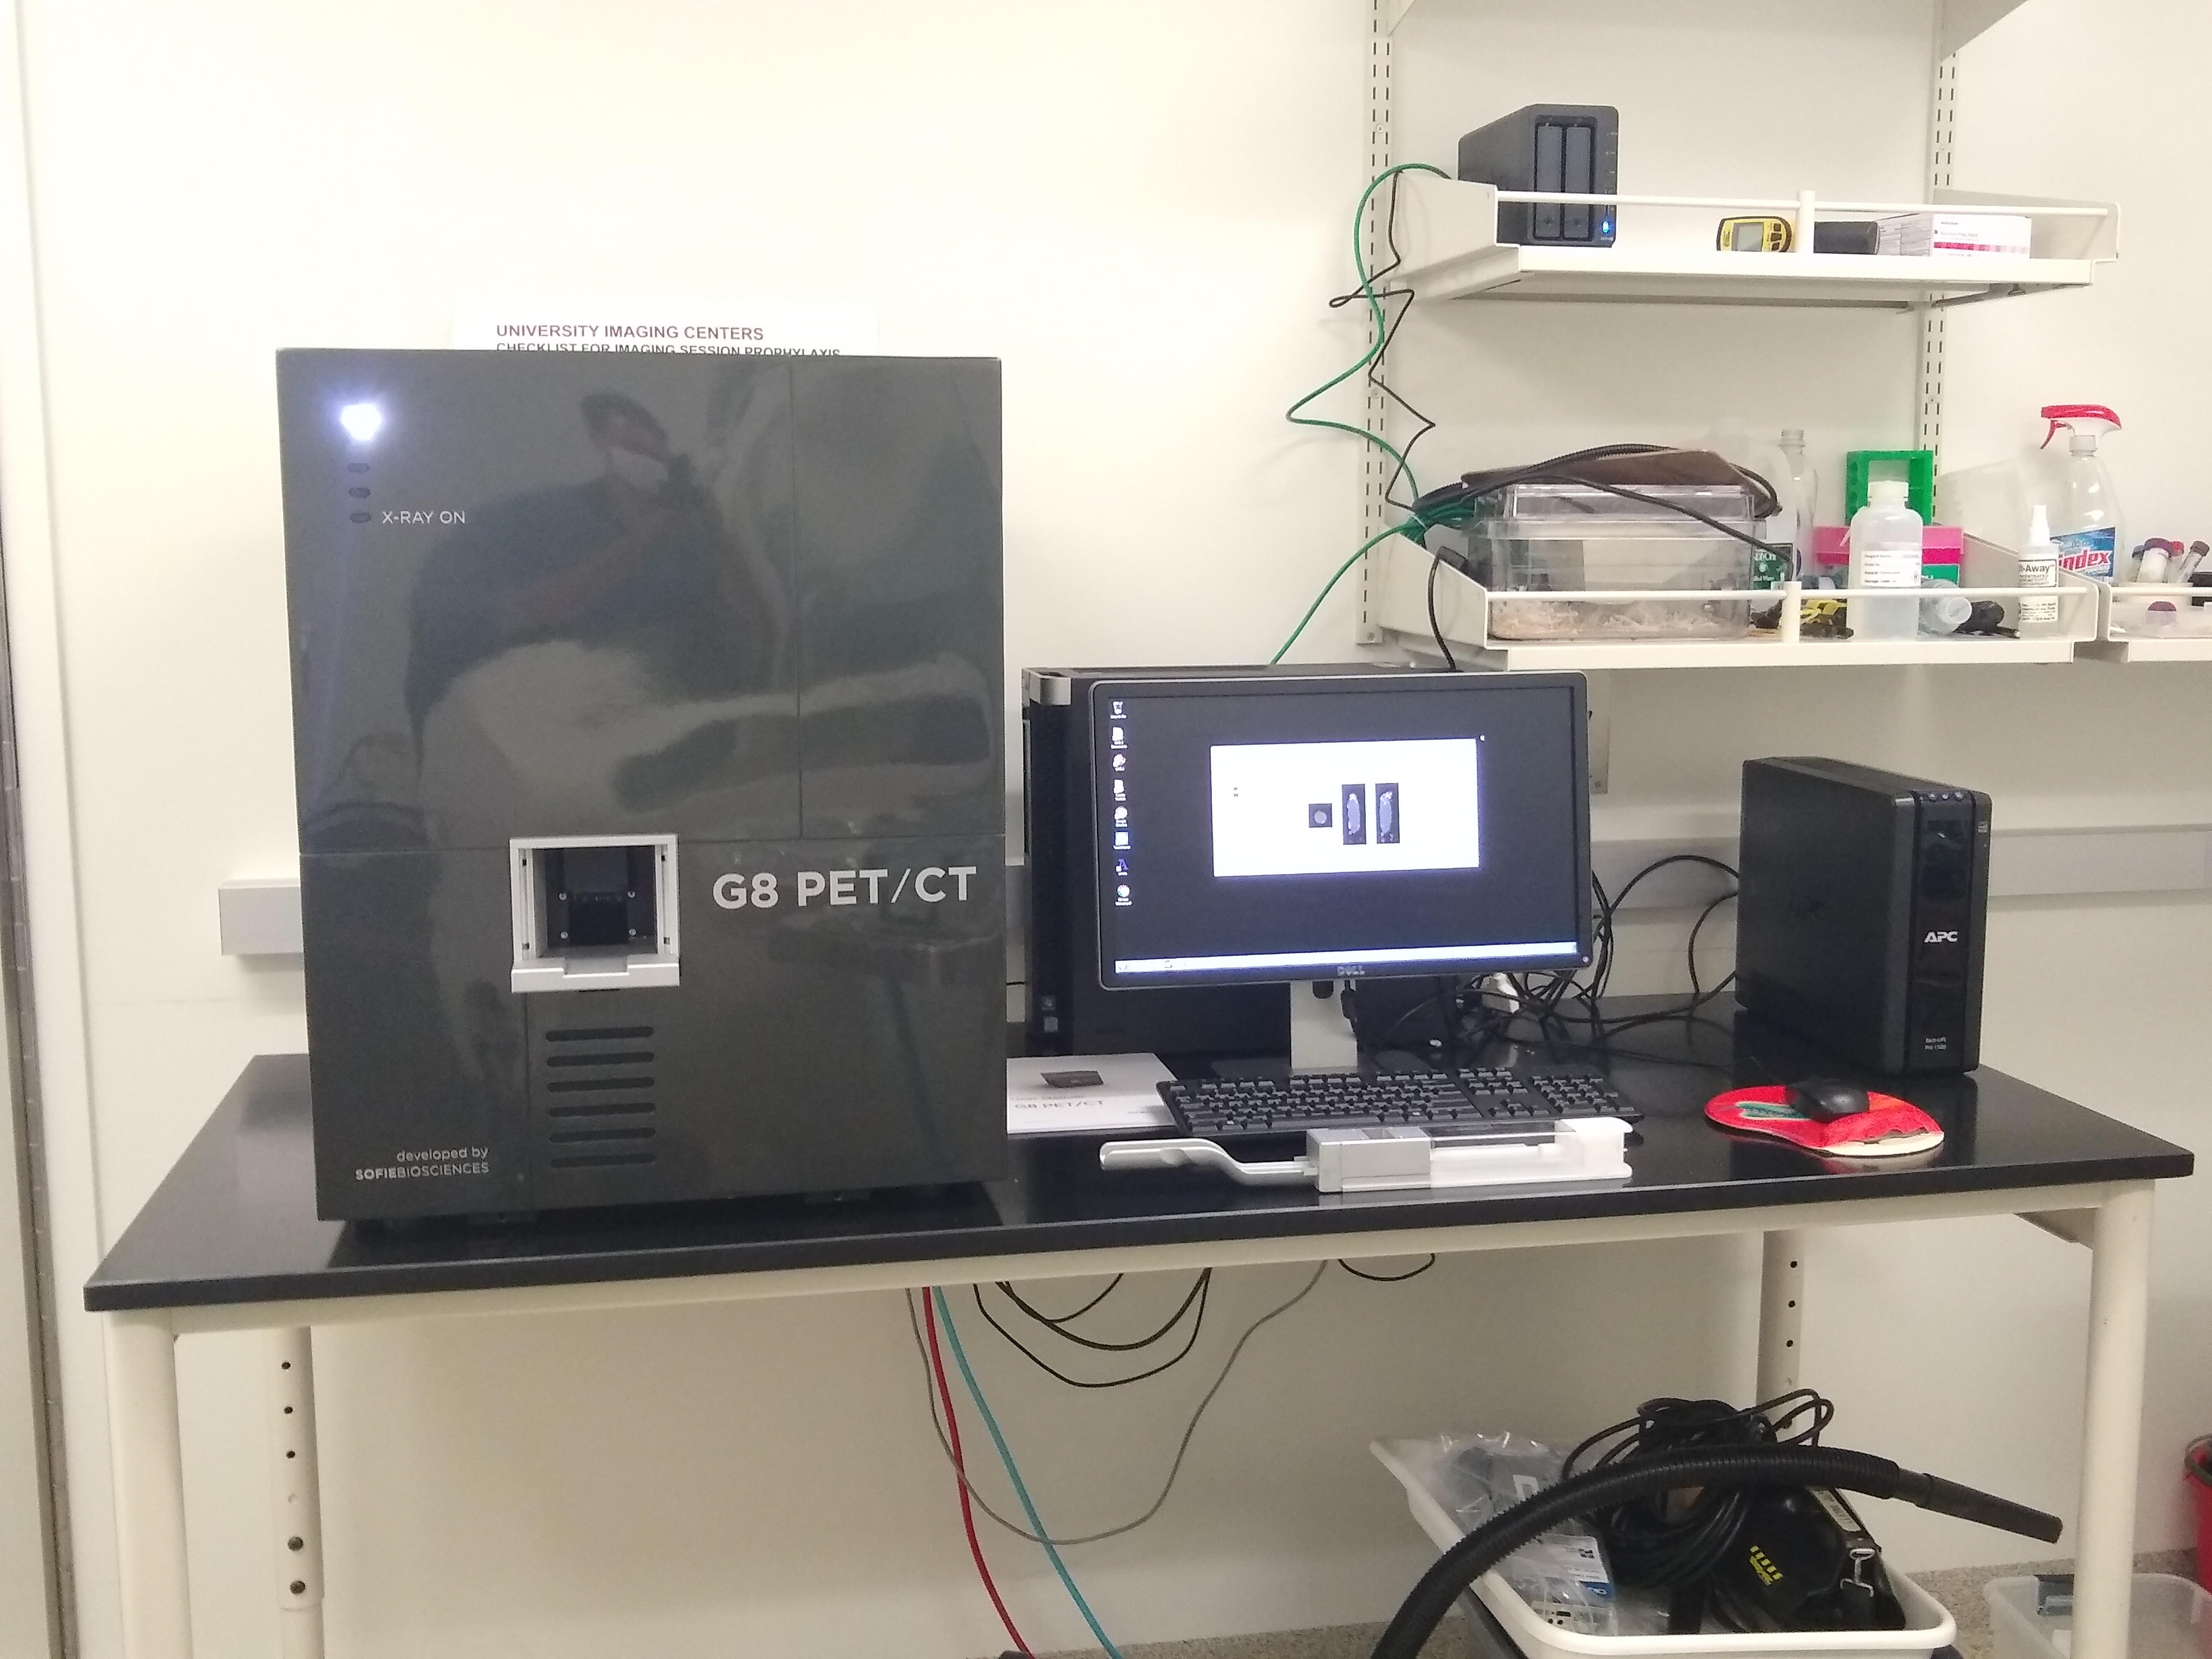
G8 PET/CT
The G8 PET/CT high-performance benchtop PET/CT imaging system offers enhanced image quality, proper animal care, safety, and increased study volume.
Employing high-resolution detectors, fast electronics, and advanced 3D image reconstruction, G8 PET / CT’s small size does not sacrifice performance (14% sensitivity, 1.4 mm resolution) or image quality.
Resolution
- 200um reconstructed CT
- 457um PET
G8 CT Specifications
| Description | Spec |
|---|---|
| X-ray Source | 59 kVp, 100uA |
| X-ray Camera | 75 micron pixels, 14bits, CMOS+Csl flat panel |
| Camera Speed | 24 fps |
| Field of View | 100mm axial by 50mm transaxial |
| Standard Scan Time | <60 seconds |
| Dimensions | 56 cm x 63 cm x 71 cm (W x D x H) |
| Weight | 90 kg |
G8 PET Performance Specifications
| Description | Spec |
|---|---|
| Axial FOV | 9.5 cm |
| Transaxial FOV | 4.7 cm |
| Detector element size | 1.8 mm x 1.8 mm x 7 mm |
| Peak absolute system sensitivity* | >14% |
| Reconstructed resolution at the center of FOV* | 1.4 mm |
| Average energy resolution | ≤18% |
| Energy window range | 150 - 650 keV |
| Total number of detector elements | 5,408 |
| Reconstruction algorithm | 3D ML-EM |
Vevo F2
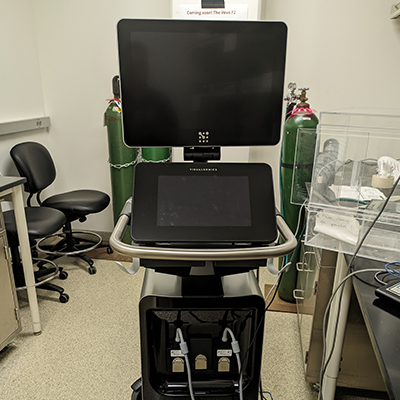
Vevo F2
Ultra-high to low frequency ultrasound (71–1 MHz) allows for imaging a range of animal models. Users now have the flexibility to image at low frequency for penetration and ultra-high frequency for resolution.
Available Licenses
Acquisition Software
Analysis Software
Jackson Hall
IVIS Spectrum In vivo Imaging System
IVIS Spectrum
The IVIS Spectrum is the most versatile and advanced optical animal in vivo imaging system available on the market today. An optimized set of high-efficiency filters and spectral unmixing algorithms lets you take full advantage of bioluminescent and fluorescent reporters across the blue to near-infrared wavelength region. It also offers 3D tomography for both fluorescent and bioluminescent reporters that can be analyzed in an anatomical context using the Digital Mouse Atlas.
For advanced fluorescence imaging, the IVIS Spectrum has the capability to use either trans-illumination (from the bottom) or epi-illumination (from the top) to illuminate in vivo fluorescent sources. 3D diffuse fluorescence tomography can be performed to determine source localization and concentration using the combination of structured light and trans-illumination fluorescent images. The instrument is equipped with 10 narrow-band excitation filters (30 nm bandwidth) and 18 narrow-band emission filters (20 nm bandwidth) that assist in significantly reducing autofluorescence by the spectral scanning of filters and the use of spectral unmixing algorithms. In addition, the spectral unmixing tools allow the researcher to separate signals from multiple fluorescent reporters within the same animal.
Detector
- Andor Back-thinned, Back-illuminated CCD, cooled to -90 degrees C
- 2048 x 2048 Pixels Array, 13.5-micron sensor size
- 21.5 cm maximum image width (up to 5 mice)
Excitation
- 430-745 nm (10 filters)
- ND2 filter for trans-illumination
Emission
10 excitation filters with 30 nm bandwidth, and 18 emission filters with 20 nm bandwidth. The central filter wavelength is listed.
| Excitation | Emission |
|---|---|
| 430 | 500 |
| 465 | 520 |
| 500 | 540 |
| 535 | 560 |
| 570 | 580 |
| 605 | 600 |
| 640 | 620 |
| 675 | 640 |
| 710 | 660 |
| 745 | 680 |
| 700 | |
| 720 | |
| 740 | |
| 760 | |
| 780 | |
| 800 | |
| 820 | |
| 840 |
Vevo 2100 Ultra High-Frequency Ultrasound
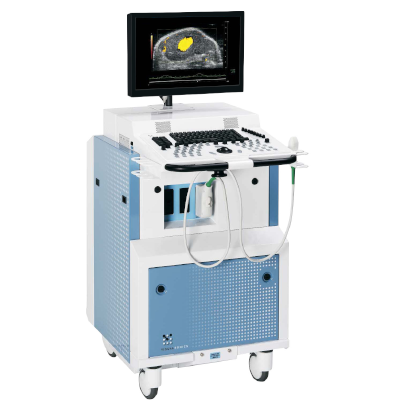
Vevo 2100
Ultra High-Frequency ultrasound for small animal research has linear array technology, ideal for cardiovascular and cancer imaging.
The MicroScan transducers provide increased frame rates, superb contrast, unrivaled resolution and a wider field of view.
Available Imaging options for the Vevo 2100 system:
- Super B-Mode (2D) imaging for anatomical visualization and quantification, with an enhanced temporal resolution with frame rates up to 740 fps (in 2D for a 4x4 mm FOV) , and enhanced image uniformity with multiple focal zones.
- M-Mode for visualization and quantification of wall motion in cardiovascular research, single line acquisition allows for the very high-temporal (1000fps) resolution necessary for the analysis of LV function.
- Anatomical M-Mode for adjustable anatomical orientation in reconstructed M-Mode imaging; the software automatically optimizes the field of view for maximum frame rate.
- Pulsed-Wave Doppler Mode (PW) for quantification of blood flow.
- Color Doppler Mode for detection of blood vessels including flow directional information and mean velocities; as well as for identification of small vessels not visible in B-Mode.
- Power Doppler Mode for detection and quantification of blood flow in small vessels not visible in B-Mode; increased frame rates allow for significantly faster data acquisition.
- Tissue Doppler Mode for quantification of myocardial tissue movement; for example in assessing diastolic dysfunction.
- Vevo MicroMarker Nonlinear Contrast Agent Imaging - for quantification of relative perfusion & molecular expression of endothelial cell surface markers; enhanced sensitivity to Vevo MicroMarker contrast agents as linear tissue signal is suppressed.
- 3D-Mode Imaging for anatomical and vascular visualization, when combined with either B-Mode, Power Doppler Mode, or Nonlinear Contract Imaging; allows for quantification of volume and vascularity within a defined anatomical structure.
- Digital RF-Mode for the acquisition and exportation of radio frequency (RF) data in digital format for further analysis; full screen acquisition provides a complete data set for more comprehensive analysis and tissue characterization.
| Transducer | MS 250 | MS 400 | MS 550D | MS 700 |
|---|---|---|---|---|
| Primary Appl. | rat cardiology and abdominal (< 400 g) large tumor imaging (up to 23mm in diameter) all contrast applications | mouse cardiovascular, rat abdominal, rabbit eye, all vascular (mouse, rat, rabbit) | mouse abdominal, reproductive mouse, rat embryology tumor imaging (up to 14 mm in diameter) mouse vascular small rat vascular, some abdominal (kidney) | mouse embryology, epidermal imaging, superficial tissue, subcutaneous tumors (< 9 mm), mouse vascular, ophthalmology |
| Centre Frequency | 21 MHz | 30 MHz | 40 MHz | 50 MHz |
| Bandwidth | 13-24 MHz | 18-38 MHz | 22-55 MHz | 30-70 MHz |
| Geometric Focus | 15.0 mm | 9.0 mm | 7.0 mm | 5.0 mm |
| Image Width (Max) | 23.0 mm | 15.4 mm | 14.1 mm | 9.7 mm |
| Image Depth (Max) | 30.0 mm | 20.0 mm | 15.0 mm | 12.0 mm |
| Frame Rate (Single Zone) FOV (Width) | 376 (6.04 mm) | 449 (5.36 mm) | 557 (5.08 mm) | 476 (4.73 mm) |
| Image Axial Resolution | 75 μm | 50 μm | 40 μm | 30 μm |
| Image Lateral Resolution | 165 μm | 110 μm | 90 μm | 75 μm |
| Basic Contrast (Fundamental) | Yes | Yes | Yes | Yes |
| Nonlinear Contrast | Yes | No | No | No |
| Max Steering (Doppler) | 15 degrees | 15 degrees | 15 degrees | 15 degrees |
| Microbubble Burst Slice Thickness a,b | 765 μm | 570 μm | 590 μm | 630 μm |
| Footprint | 28.0 mm x 5.75 mm | 20.0 mm x 5.0 mm | 20.0 mm x 5.0 mm | 15.0 mm x 4.0 mm |
Aspect Imaging M5 Compact MRI
M5 MRI
The M5 compact 1.0 Tesla, high-performance MRI system is designed with a larger bore opening for dedicated imaging of both mice and rats. The system provides non-invasive 3D anatomical, functional, and molecular read-outs in rodents and ex vivo samples.
The M compact, high-performance MRI system enables high-resolution 3D whole-body morphological imaging of mouse models of disease. Biologists and researchers without prior MR or imaging experience can now leverage the gold standard modality – MRI – for morphological imaging. The M5 quickly generates reproducible, quantitative results of phenotypes and therapeutic efficacy. For more information, see the Aspect Imaging M5 website.

Wildtype mouse vertebral column, T2 weighted image obtained with the Aspect Imaging M5 Magnetic Resonance Imager. Yellow arrows indicate clearly defined intervertebral discs (IVDs); magenta arrows indicate fused lumbar IVDs, a normal developmental process. Scale bar = 1 mm. Image courtesy of Dr. Scott Thompson; laboratory of Dr. Laura Stone, Department of Anesthesiology, University of Minnesota.
Applications
- Cancer
- Cardiovascular
- Contrast-based Molecular Imaging
- Diabetes and Obesity
- Embryology/Developmental Biology
- Nephrology, Neurobiology
- Stem Cell/Cell Tracking
Gradients
- Strength– 430 (X,Y,Z) mT/m @ 60 A
- Linearity (for Entire Imaging Volume)– Better than 5%
- Slew Rate (T/m/s)– 1720 T/m/s @ 60 A / 250 us
Imaging Pulse Sequences
| Sequence | Description |
|---|---|
| Spin Echo | 2D DWI – with diffusion gradients IR – with preceding inversion pulse |
| Fast Spin Echo | 2D and 3D DWI – with diffusion gradients IR – with preceding inversion pulse |
| Gradient Echo | 2D and 3D |
| IRSnap | GRE based with multiple inversion time |
| DCE | GRE based Dynamic Contrast Enhancement |
| Cardiac Cine | GRE based ECG triggered Cine |
| DTI | FSE based diffusion tensor imaging |
| Dixon | FSE based fat separation |
| Field of View | 90 x 90 x 60 mm3 spheroid |